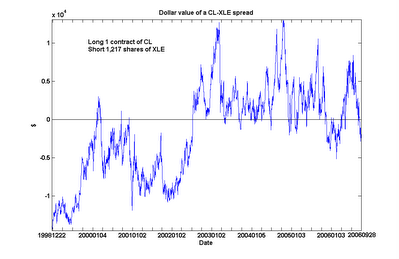
 An interesting feature emerged from this extended analysis. CL and XLE are still found to be cointegrated over this long period, albeit with a slightly lower probability (90%). However, we can see something of a regime shift around mid-2002, when CL went from generally under-valued to over-valued relative to XLE. (Even after including this regime with lower relative crude oil prices in my calculations, I still find the current spread to be undervalued by about $10,521 as of the close of Nov 17, which is near its 6-year low.)
What was the reason for this apparent shift in mid-2002? And are we in the middle of a similar regime shift in the opposite direction? Maybe our readers who have a better grasp of the economic fundamentals of the energy markets can shed light on this.
2 comments:
Hi Ernie,
I like your blog and follow it from time to time. Can you explain how did you come up with the 1217 shares of the ETF vs 1 contract of the future?
Also, wanted to know how do you create the spread between the futures contract and the EFT in the chart shown?
Thanks
Hi Anonymous,
You can find the hedge ratio between XLE and CL (or QM) by performing a linear regression of the historical prices of XLE vs the continuous front month CL contract prices over a period of, say, 1 year. Naturally, the hedge ratio will change over time, so if you perform this regression now, it will be somewhat different from 1217 shares.
The spread in the chart is created simply by subtracting 1217*XLE price from the CL contract price.
Hope this helps.
Ernie
Post a Comment